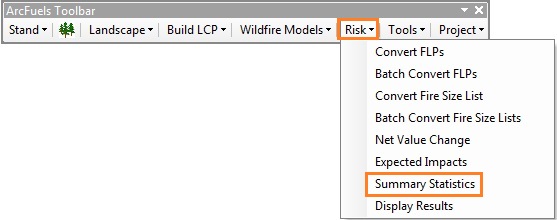

The Summary Statistics form is used to summarize FLP or FSL point data by a Grouping layer which is another shapefile. The shapefile can represent anything of interest, such as forest stands, threatened or endangered species habitat, wildland-urban interfaces (WUIs), or a combination of factors. The form has the ability to intersect the FLP or FSL point data (Two separate layers) or use data that have already been intersected (Single intersected layer). What is output is an Excel workbook.
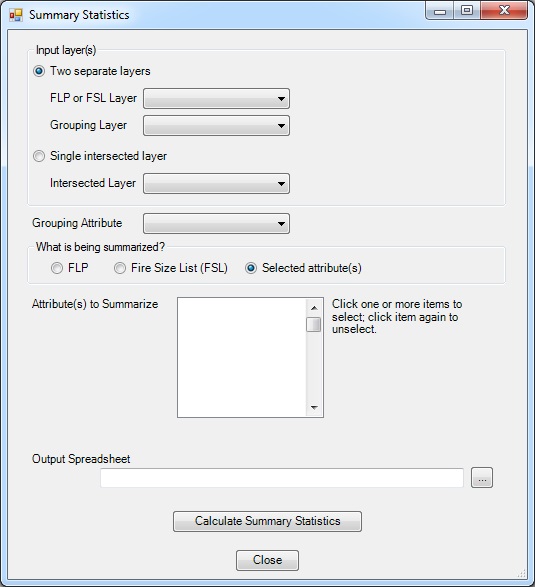
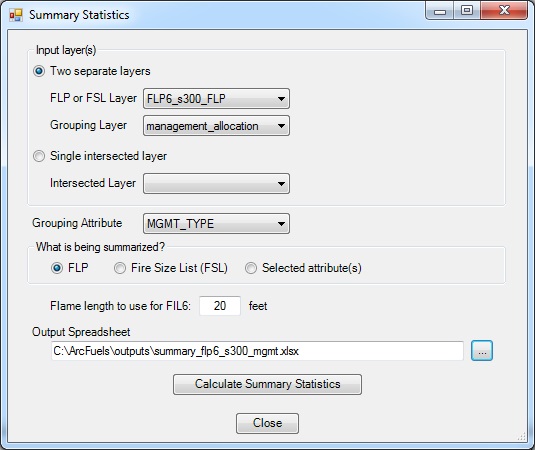
Input layer(s):
What is being summarized?
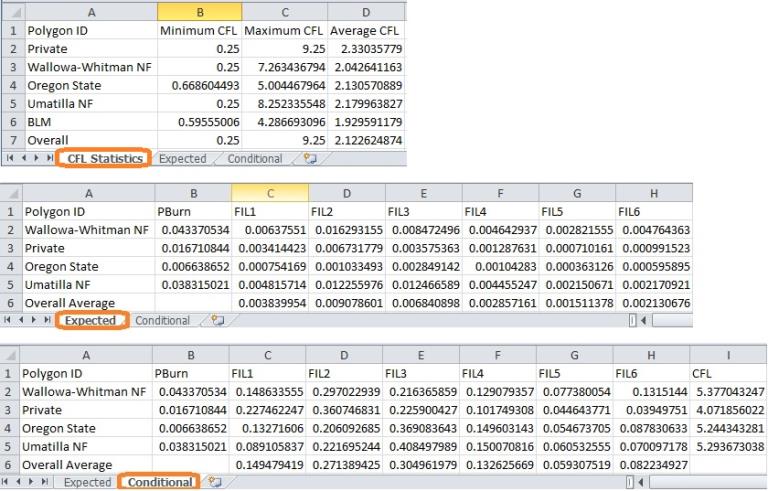
Excel worksheets for CFL,expected and conditional outputs from a 6-category FLP averaged by ownership.
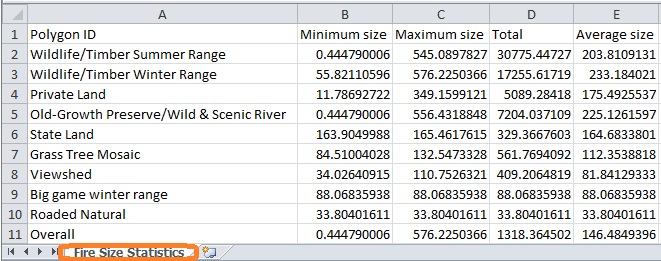
Excel worksheets for fire size averaged by management allocation.
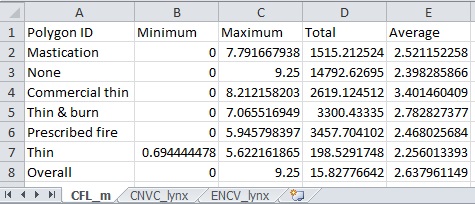
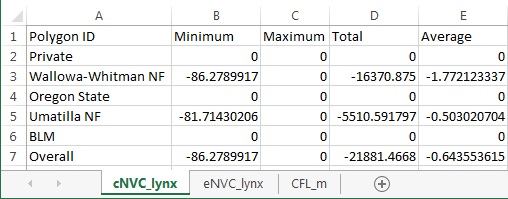
Excel worksheets for CFL, cNVC and eNVC calculated for lynx habitat averaged by proposed treatment type.
These data can be used to create scatter plots and curves to represent risk. Scatter plots and risk curves can be used to show the relative risk of different subunits (polygons) within a landscape.
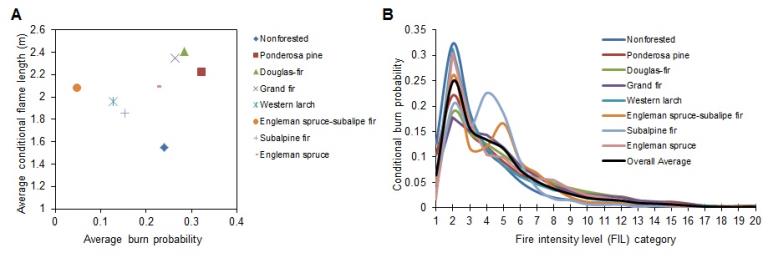
Example of wildfire risk scatter plots (A) and curves (B) from a 20-category FLP averaged by forest type.
Depending on the size of the landscape, and resolution of the run , the output FLP can contain millions of points. The Summary Statistics form in ArcFuels10 can be used to summarize both the expected and conditional probabilities in each FIL, overall burn probabilities and the conditional flame length, using another polygon shapefile to define the groups. This is helpful for understanding averages by land management allocation, forest type, species habitat, etc. In this exercise a LP - 6 Bin English (FLP6_s300_FLP converted in Exercise 25) will be averaged by land management allocation.
Click the Risk button on the ArcFuels10 toolbar, then select Averages from the drop-down list.

Fill out the Summary Statistics form following the figure below.
Go to the Excel workbook.
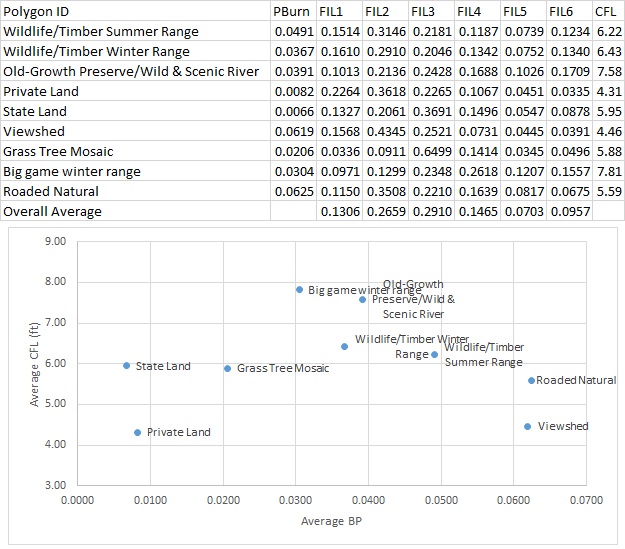
Scatter plot of wildfire risk by land management allocation. Private land has the lowest wildfire risk in the smaller sub area analyzed.
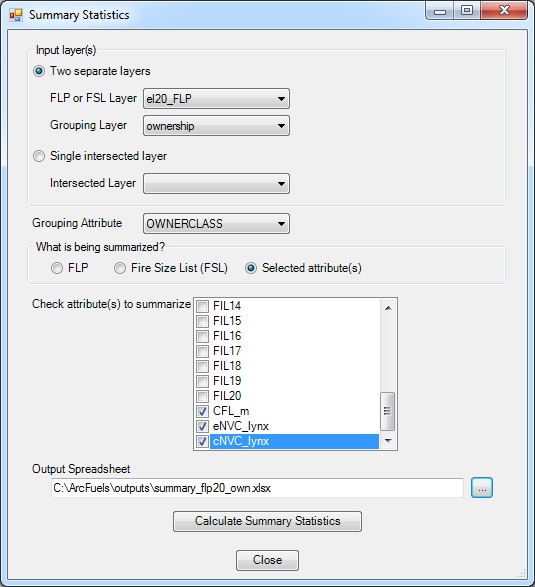
In this exercise the cNVC for lynx habitat (calculated in Exercise 28) will be summarized by land ownership .
Click the Risk button on the ArcFuels10 toolbar, then select Averages from the drop-down list.

Fill out the Summary Statistics form following the figure below.
Go to the Excel workbook.
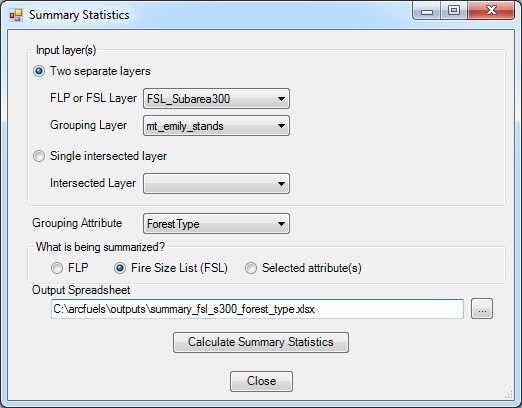
Fire size will be summarized by forest type within a sub area of the Mt. Emily landscape. This exercise will use the FSL_SubArea300 which was converted in Exercise 27.
Click the Risk button on the ArcFuels10 toolbar, then select Averages from the drop-down list.

Fill out the Summary Statistics form following the figure below.
Go to the Excel workbook.
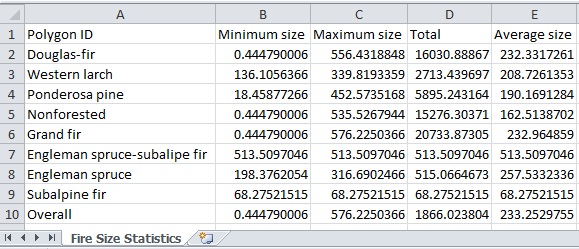
Average fire size by forest types within a sub area of the Mt. Emily landscape.
To continue to the next section go to Display Results.