
When it is not possible to directly link the effect of fire on a highly valued resource or asset (HVRA), response functions can be used instead (Calkin et al. 2010). Response functions translate positive and negative fire effects into net value change (NVC) for HVRAs based on the flame length intensity categories within the FLP file. Response functions are developed by considering the different ways in which HVRAs will respond to fire of different intensities.
Response function examples with percent net value change (+/- %) for six flame length categories.
| Response function description | FIL1 | FIL2 | FIL3 | FIL4 | FIL5 | FIL6 |
|---|---|---|---|---|---|---|
| Moderate benefit at low fire intensity decreasing to a moderate loss at very high fire intensity. | +50 | +30 | +10 | -10 | -30 | -50 |
| Losses greatly increasing from low to very high over all fire intensities. | -10 | -40 | -50 | -60 | -70 | -80 |

Example graphs of response functions of net value change by flame length categories for two different HVRAs.
Correlation between the FIL categories output in FlamMap5 FLP files and response function flame length categories. The FIL assigned is based on the mid-point value of the FIL category.
| Flame length category | Flame length (ft) | FLP 6 bin English | FLP 20 bin metric |
|---|---|---|---|
|
FIL 1 |
<2 |
FIL 1 |
FIL 1 |
|
FIL 2 |
2-4 |
FIL 2 |
FIL 2 |
|
FIL 3 |
4-6 |
FIL 3 |
FIL 3-4 |
|
FIL 4 |
6-8 |
FIL 4 |
FIL 5 |
| FIL 5 | 8-12 | FIL 5 | FIL 6-7 |
| FIL 6 | >12 | FIL 6 | FIL 8-20 |
The Net Value Change form in ArcFuels calculates both the expected and conditional NVC. The former represents an expectation of NVC that accounts for the probability of a fire, and the latter represents the change in NVC given that a fire occurs. The process combines burn probability and intensity from the FLP files with the response function to calculate a percentage change in the HVRA. The HVRA can be mapped with either a raster or a shapefile.
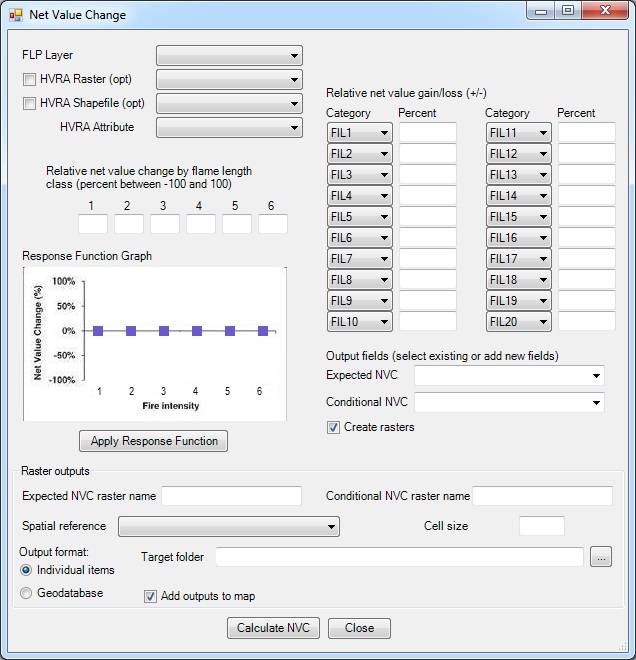
FLP and HVRA inputs:
Response function values:
Outputs:
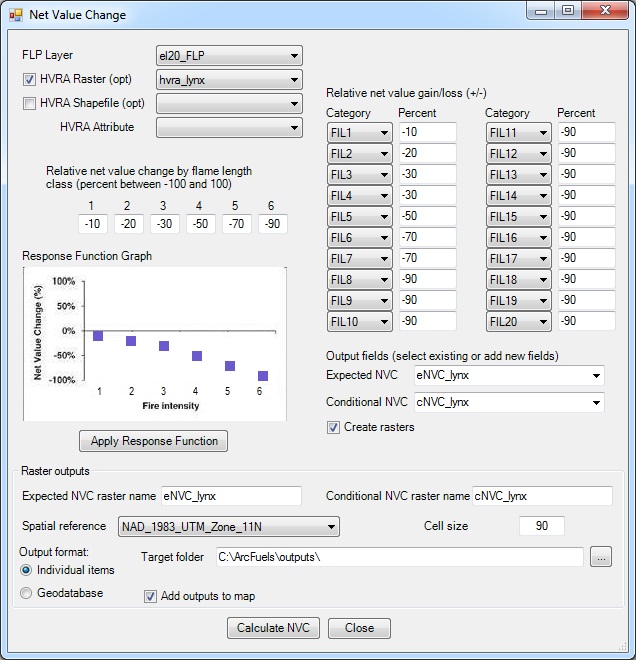
In this exercise, expected loss will be calculated for the supplied hypothetical lynx habitat raster (hvr_lynx) using the el20_FLP.shp (converted in Exercise 24), and response function described below.
For lynx habitat we will assume that fire is increasingly negative for higher flame lengths. And that translates to the following response function:
| FIL | 1 | 2 | 3 | 4 | 5 | 6 |
|---|---|---|---|---|---|---|
| NVC (%) | -10 | -20 | -30 | -50 | -70 | -90 |
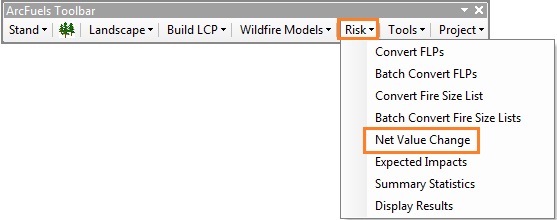
Click the Risk button on the ArcFuels10 toolbar, then select Net Value Change from the drop-down list.

Fill out the Net Value Change form following the figure below.
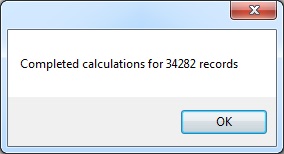
Return to ArcMap.
The newly created rasters will be within the Conversion Results directory of the Table of Contents in ArcMap.

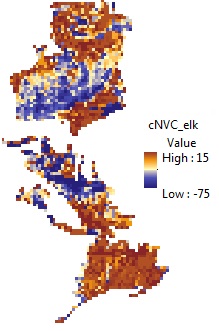
Conditional net value change for hypothetical lynx habitat (warmer colors are more negative than cooler colors).
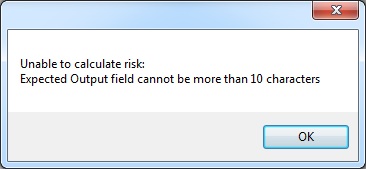
When naming the attribute fields using the Net Value Change form the names can only be 10 characters long. If the names are longer an error window will open. Press Continue to close the window, then close the progress meter using the X in the top right-hand corner, and re-name the fields.
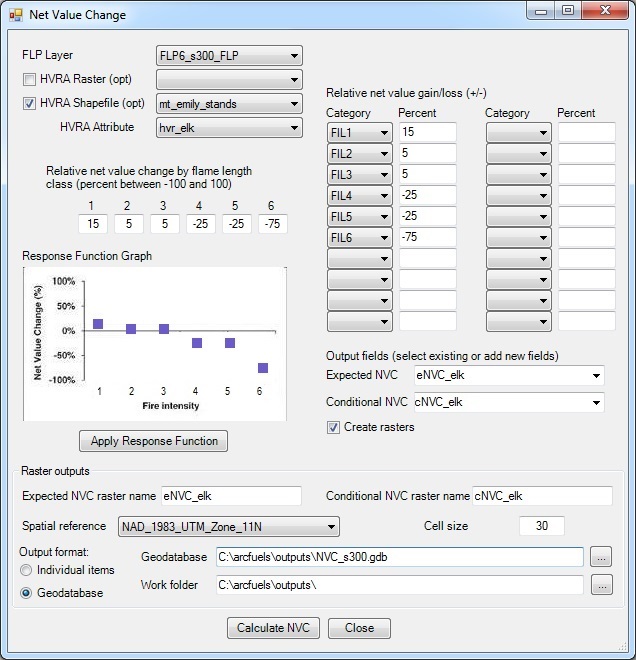
In this exercise, expected loss will be calculated for the supplied hypothetical elk habitat using the an attributed shapefile for a sub area of the Mt. Emily landscape where FlamMap5 was run. The FLP we will use was converted in Exercise 25, FLP6_s300_FLP.shp, and response function described below.
For elk habitat we will assume that low severity fire is beneficial but higher severity fire is increasingly negative. And that translates to the following response function:
| FIL | 1 | 2 | 3 | 4 | 5 | 6 |
|---|---|---|---|---|---|---|
| NVC (%) | 15 | 5 | 5 | -25 | -25 | -75 |
Click the Risk button on the ArcFuels10 toolbar, then select Net Value Change from the drop-down list.

Fill out the Net Value Change form following the figure below.
Return to ArcMap.
To continue to the next section go to Expected Impacts.