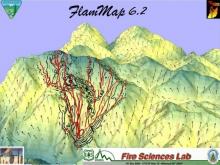
FlamMap is a fire analysis desktop application that ONLY runs in a 64-bit Windows Operating System environment. It can simulate potential fire behavior characteristics (spread rate, flame length, fireline intensity, etc.), fire growth and spread and conditional burn probabilities under constant environmental conditions (weather and fuel moisture). With the inclusion of FARSITE it can now compute wildfire growth and behavior for longer time periods under heterogeneous conditions of terrain, fuels, fuel moistures and weather.)
The FlamMap fire mapping and analysis system (Finney 2006) describes potential fire behavior for constant environmental conditions (weather and fuel moisture). Fire behavior is calculated for each pixel within the landscape file independently. Potential fire behavior calculations include surface fire spread, flame length, crown fire activity type, crown fire initiation, and crown fire spread. Dead fuel moisture and conditioning of dead fuels in each pixel based on slope, shading, elevation, aspect, and weather. With the inclusion of FARSITE, FlamMap can now compute wildfire growth and behavior with detailed sequences of weather conditions.
The FlamMap fire mapping and analysis system includes FARSITE (Finney 1998, 2004) and FlamMap BASIC (Finney 2006), Minimum Travel Time (MTT, Finney 2002, 2006), Treatment Optimization Model (Finney 2001, 2006, 2007), and Conditional Burn Probability (Finney 2005, 2006). It incorporates the following fire behavior models:
- Rothermel's (1972) surface fire spread model,
- Van Wagner's (1977) crown fire initiation model,
- Rothermel's (1991) crown fire spread model,
- Albini's (1979) spotting model,
- Finney’s (1998) or Scott and Reinhardt’s (2001) crown fire calculation method, and
- Nelson's (2000) dead fuel moisture model. This allows conditioning of dead fuels in each pixel based on slope, shading, elevation, aspect, and weather.
Because environmental conditions remain constant when using FlamMap, MTT, Burn Probability, and TOM it will not simulate temporal variations in fire behavior caused by weather and diurnal fluctuations as FARSITE does. Nor will it display spatial variations caused by backing or flanking fire behavior. These limitations need to be considered when viewing FlamMap output using these models in a relative sense rather than absolute sense. However, these outputs are well-suited for landscape level comparisons of fuel treatment effectiveness because fuel is the only variable that changes. Outputs and comparisons can be used to identify combinations of hazardous fuel and topography, aiding in prioritizing fuel treatments.
The FlamMap software creates a variety of vector and raster maps of potential fire behavior characteristics (for example, spread rate, flame length, crown fire activity) and environmental conditions (dead fuel moistures, mid-flame wind speeds, and solar irradiance) over an entire landscape or for specific modeling applications these same outputs are limited to the simulation footprint (MTT and FARSITE). These raster maps can be viewed in FlamMap or exported for use in a GIS, or image format.
The FlamMap software also creates a variety of vector outputs specific to each modeling system within the application. Gridded wind vectors are produced whenever WindNinja is used within the application and information on spotting (tabular and shapefile format) are also created. MTT creates MTT flow paths and MTT Arrival Contours. Within FARSITE, Wind and Spread Vectors, and FARSITE Perimeters are also produced.
Required geospatial Landscape Data
The FlamMap program requires eight geospatial data layers to create a valid landscape file (.LCP)
- Topographic (Elevation, Slope, Aspect)
- Fire Behavior Fuel Models
- Forest Canopy Cover
- Forest Canopy Height
- Forest Canopy Base Height
- Forest Canopy Bulk Density
Required geospatial data for use in FlamMap for the Continental United States, Alaska, and Hawaii can be accessed from the LANDFIRE Program: https://www.landfire.gov/index.php.
WindNinja
WindNinja’s conservation of Mass Solver using domain average winds has been incorporated into FlamMap allowing for the use of gridded wind information generated within the program for any simulation. Gridded winds using desk top WindNinja’s full mass and momentum solver can also be used in any simulation as well. Please see the WindNinja page for more information.
SpatialFOFEM
SpatialFOFEM a spatial implementation of the point-scale FOFEM model is available in FlamMap6.2. Currently, it only provides quantitative fire effects information for fuel consumption, carbon loading, and combustion emissions using a GeoTIFF spatial representation of fuels (typically based on LANDFIRE mapped FCCS fuel beds LF FCCS). FlamMap includes a set of tutorials and data as examples to work through and gain understanding on how to use the application within FlamMap. More information on the Spatial FOFEM application is available at SpatialFOFEM.
Training
An online tutorial is included in the online Help and example data sets are provided with the installation download. Currently, no formal training course exists for FlamMap.
Technical Support
The first level of technical support is provided through your local support channels. Second level technical support is provided by the USDA Forest Service Fire and Aviation Interagency Incident Applications (IIA) HelpDesk.
HelpDesk Contact Information:
- Phone: (866) 224-7677 or (616) 323-1667,
- Fax: (616) 323-1665
- E-mail: iia-helpdesk@usda.gov
- Website: https://iiahelpdesk.nwcg.gov/
The IIA HelpDesk is available for help with software issues only and cannot answer fire behavior modeling questions.