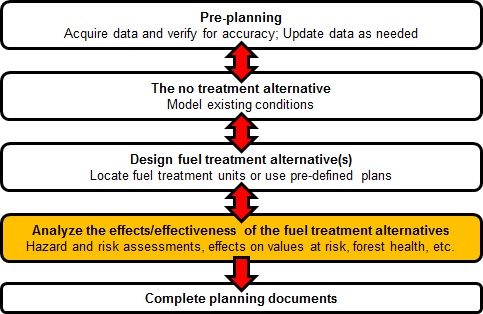

After all the fire modeling has been completed for all the various treatment alternatives the effects of the alternatives on potential fire behavior, exposure and risk need to be summarized. There are many ways to do this. The examples below will only demonstrate a few options using all the outputs we generated with FlamMap for out three alternatives: no-treatment, resilience and hazard.
Most of the steps in the exercises in this section will use ArcMap and Excel. A few will also leverage tools from ArcFuels.
There are five exercises in this section:
In ArcMap it is possible to batch process many of the functions in ArcToolbox. By using the batch function you can set up many runs all at once, which is great when doing treatment alternative comparisons.
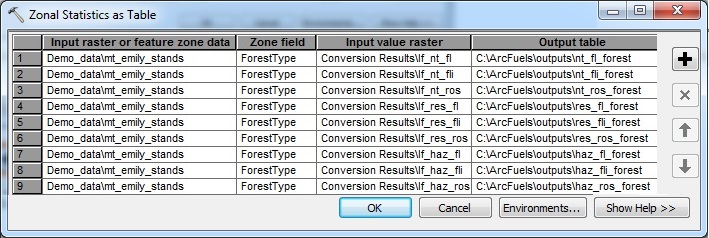
In this exercise, the Zonal Statistics as Table form in ArcMap will be used in batch mode to summarize flame length, rate of spread, and fireline intensity within the Mt. Emily project area by forest type. This includes 9 rasters, three for each of the alternatives (no-treatment, pre-planned treatment, and hazard treatment). Zonal Statistics as Table outputs a table of summary statistics (min, max, range, mean, etc.) of a raster within a defined “zone.” A zone can be defined with another raster or with any attribute within a shapefile.
Using the Zonal Statistics as Table tool in ArcToolbox fire behavior metrics will be summarized.
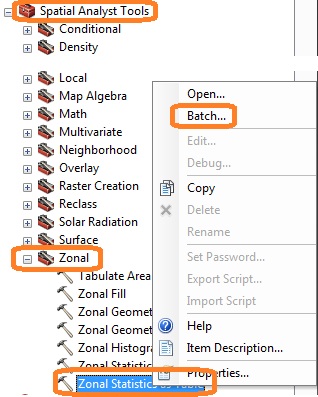

Switch the ArcMap table of contents view to List By Source using the  button. This allows you to see the tables created.

Zonal statistics table for flame length for the no-treatment alternative.
Mean flame length (ft), fire line intensity (kW/m), and rate of spread (ch/hr) by forest type for three treatment alternatives derived with LANDFIRE data.
| Forest Type | |||||||||
|---|---|---|---|---|---|---|---|---|---|
|
Fire behavior |
DF |
ES |
ES-SF |
GF |
LP |
NF |
PP |
SF |
WL |
|
No treatment |
|||||||||
|
Flame length |
54 |
39 | 60 | 49 | 71 | 16 | 53 | 66 | 47 |
|
Fireline intensity |
20,412 | 15,552 | 22,174 | 17,518 | 26,963 | 5,073 | 20,365 | 24,498 | 16,722 |
|
Rate of spread |
66 | 69 | 79 | 56 | 85 | 43 | 68 | 79 | 64 |
|
Resilience |
|||||||||
|
Flame length |
45 | 12 | 29 | 31 | 28 | 15 | 39 | 50 | 26 |
|
Fireline intensity |
16,576 | 3,200 | 9,930 | 10,912 | 9,721 | 4,641 | 14,493 | 18,359 | 8,690 |
|
Rate of spread |
56 | 42 | 45 | 37 | 39 | 41 | 54 | 61 | 41 |
|
Hazard |
|||||||||
|
Flame length |
6 | 38 | 60 | 48 | 9 | 15 | 4 | 66 | 45 |
|
Fireline intensity |
1,751 | 12,387 | 21,989 | 17,182 | 2,671 | 4,476 | 1,125 | 24,314 | 16,175 |
|
Rate of spread |
11 | 68 | 75 | 54 | 17 | 41 | 8 | 78 | 62 |
The hazard alternative treated almost 40% whereas the resiliency treatment alternative only treated 20% of the landscape. Both reduced expected fire behavior relative to the no-treatment alternative.The hazard alternative that targeted areas of extreme hazard in Douglas-fir (DF), lodgepole pine (LP) and ponderosa pine (PP) was very effective at reducing potential fire behavior in the forest types targeted. The resiliency alternative was effective at reducing potential fire behavior across all forest types. The non-forest (NF) stands saw little to no reductions because these were not targeted for treatment.
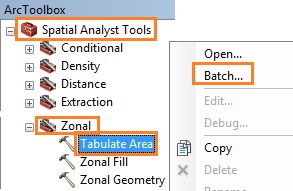
In this exercise the Tabulate Area tool in ArcMap will be used to determine the percentage of area within and outside of treatments to compare the no-treatment alternative to each the resiliency and hazard treatment alternatives. To do this the no-treatment alternative will be summarized twice, once using each treatment alternatives treatment plan. The Tabulate Area tool doesn't calculate the acres in each class, but rather the product of the cell count and cell area (900 sq m). Rather than converting this to acres, we will calculate the percentage
Using the Tabulate Area tool in ArcToolbox, calculate the crown fire activity area for treatment alternatives.

Switch the ArcMap table of contents view using List By Source  button. This allows you to see the tables created.

- The VALUE field is the zones where 0=no-treatment, 1=treated lodgepole pine, 2=treated Douglas-fir, and 3=treated ponderosa pine.
- The VALUE_0, VALUE_1, etc. fields are the area within each crown fire activity class.
- Using the Switch Selection button
select all the fields.
- Right-click in the left margin, and select Copy selected.
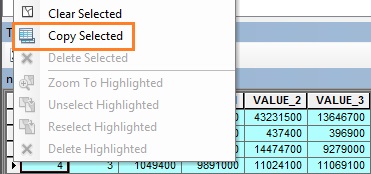
- Paste the data into Excel. Sum the treated VALUE fields, and calculate the percentage of area inside and outside of treatments by crown fire activity class.
- Repeat the process for the haz_cfa_haz table.

 select all the fields.
Percentage of crown fire activity outside of treatment units and inside of treatment units for two treatment alternatives before and after treatment.
|
Crown Fire Activity |
Outside |
No Treatment Inside |
Treated Inside |
|---|---|---|---|
|
Resilience |
|||
| No Fire | 11% | 0% | 0% |
|
Surface fire |
29% | 20% | 98% |
|
Passive crown fire |
40% | 50% | 2% |
|
Active crown fire |
19% | 30% | 0% |
|
Hazard |
|||
| No Fire | 14% | 2% | 0% |
|
Surface fire |
28% | 27% | 94% |
|
Passive crown fire |
44% | 39% | 5% |
|
Active crown fire |
14% | 31% | 1% |
Both treatment alternatives were very successful at reducing crown fire activity within treatment units.
In this exercise, scatter plots will be created to complete an exposure analysis for structures within the Mt. Emily WUI. Burn probability and conditional flame length will be intersected with the supplied structure shapefile.
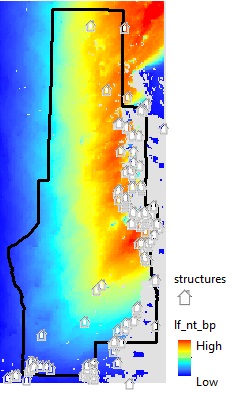
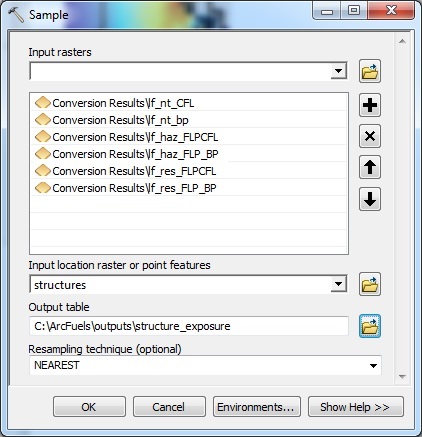
Using the Sample tool in ArcToolbox, intersect the structures with burn probability and CFL for all the alternatives.
Switch the ArcMap table of contents view to List By Source using the  button. This allows you to see the tables created.

- Using the table options button
select the Create Graph... option.
- Fill out the form following the figure below.
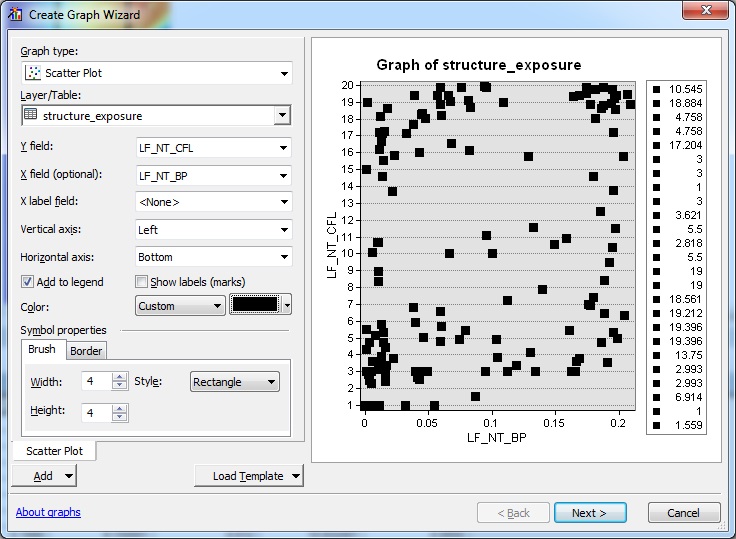
- Click the Add button and select New Series. Add the resilience alternative data. Change the color of the symbol to be different,
- Repeat the process for the hazard scenario. Change the color of the symbol to be different,
- Re-name the scatter plots, by clicking on the tab name (bottom) and typing the correct alternative name.
- Click the Next > button to name the chart, label axis etc.
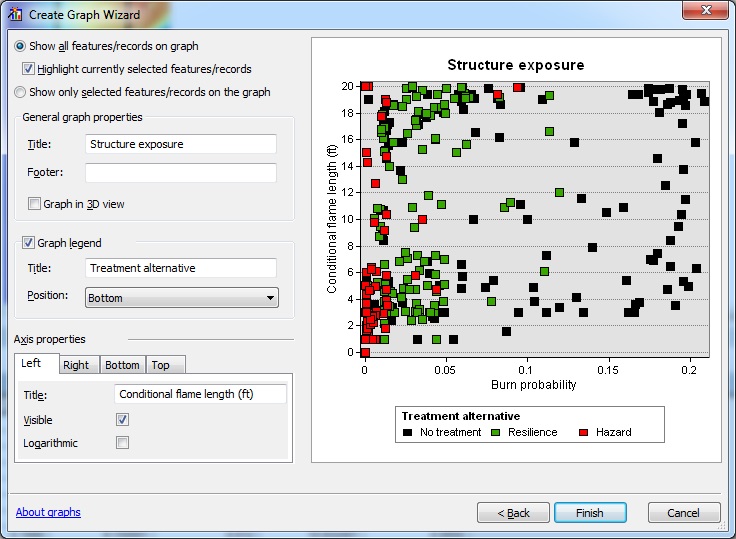
- Click the Finish button to create the chart.
- Right-click on the image and select Export.... Save the chart as a JPEG in your outputs folder.
- Close the chart window when you are done.
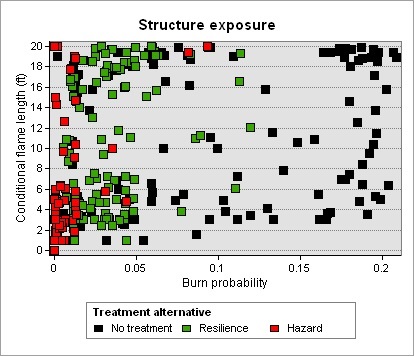
Remember a scatter plot can be used to show relative exposure amongst HVRAs or changes to exposure as a result of treatment. A shift from the upper right hand corner to the lower left hand corner signifies a reduction in exposure. Both treatments reduced exposure to the structures. However, the hazard treatment was more effective.
You will notice there are quite a few structure with very low BP and CFL. This is because of their location. The are within an area that is classified as non-burnable by LANDFIRE. Depending on your location, this might be accurate, especially for structure in an urban area. However, if the structures are surrounded by burnable fuels, such as agricultural fields after they have been planted and cured, you should critique and update your input data.
Because random ignitions were used in the FlamMap run, your scatter plot will not match that seen here. However, the same trends should hold true.
You are interested in seeing how your fuel treatment alternatives have altered wildfire transmission to old growth within the larger study area. You want to know if fewer fires are likely to burn this habitat after treatment, and if those fires that do interact with it are smaller in size.
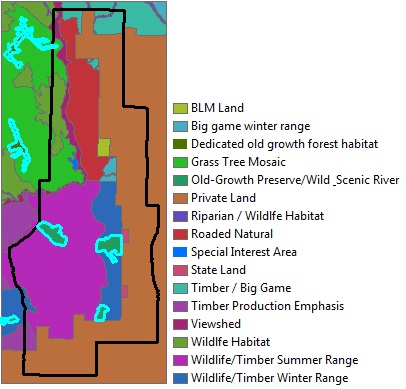
Map of management allocations in the larger study area with dedicated old growth forest habitat and old growth preserve/wild scenic river highlighted.
To complete this analysis fires that intersect the old growth will be selected and summarized for each of the three alternatives. Both the simulated perimeters and the converted fire size lists will be needed to complete the analysis. This is because the fire size information is within the fire size list file.
Using the Select by Attributes tool in ArcMap, select the old growth units.

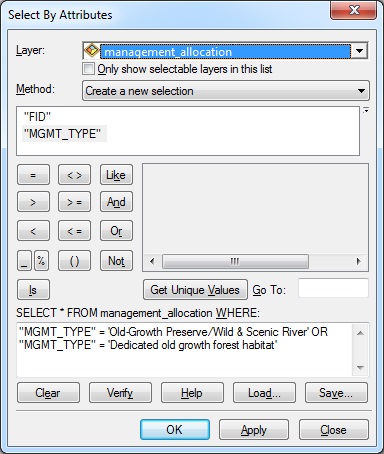
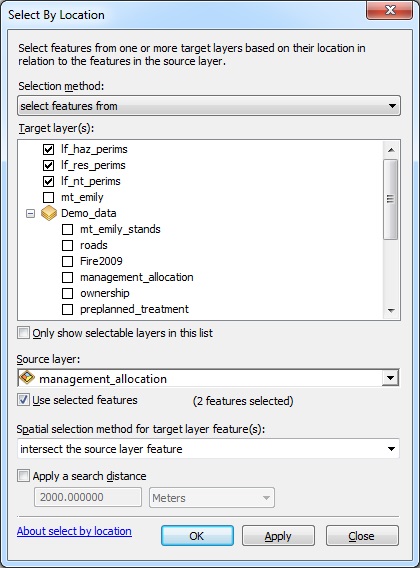
Using the Select by Location tool in ArcMap, select the fires intersecting the old growth units.

Open the attributes tables for the three perimeter files.
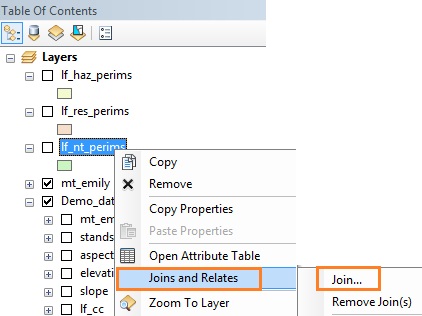
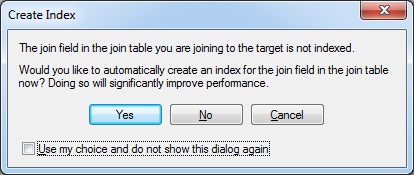
Join the fire size list files to the fire perimeter shapefile.
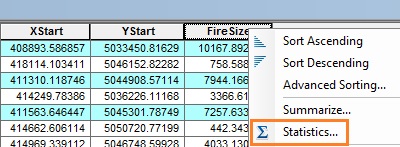
To determine the mean and maximum fire size that intersected old growth, the Statistics... option in the attributes table will be used for the FireSize field
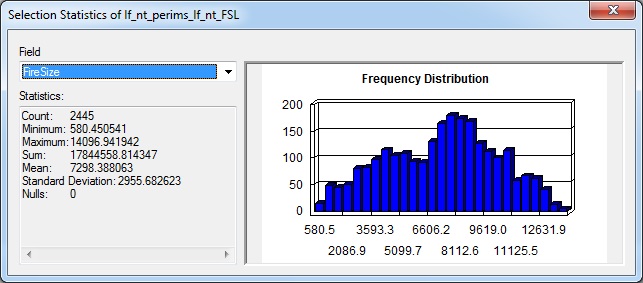
 clear the ArcMap selection.
Number of fires and average size by
|
Crown Fire Activity |
# fires |
Mean size (ac) |
Max size (ac) |
|---|---|---|---|
| No treatment | 2,445 | 7,299 | 14,098 |
| Resilience | 1,968 | 4,082 | 9,655 |
| Hazard | 1,757 | 4,164 | 9,057 |
Treatment resulted in a 20% and 28% reduction in the number of fires burning in old growth for the resilience and hazard alternatives, respectively. Mean fire size was also reduced by 42-44% and maximum fire size by 31-35%.
Because random ignitions were used in the FlamMap run, your numbers will not match those seen here. However, the same trends should hold true.
Within the Mt. Emily landscape there are three highly valued resources and assets: lynx habitat, elk habitat, and watersheds that surround important water sources. A workshop was conducted that had local experts and various stakeholders present to create response functions for each HVRA and assign a relative importance score to each. It is your responsibility to calculate the relative extent of each HVRA and the NVC.
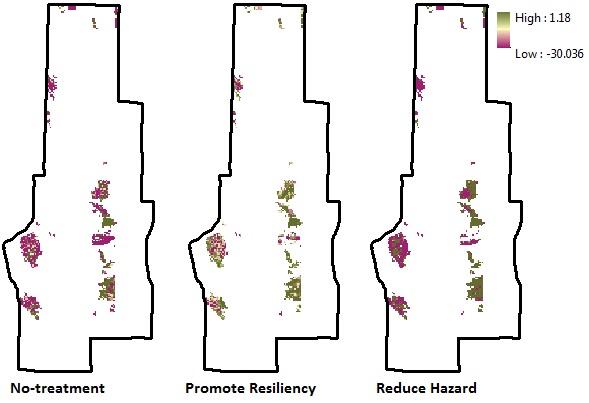
Within ArcFuels the Net Value Change calculations are automated. However, because there are multiple HVRAs we need to calculate the weighted NVC (wNVC). To do this NVC is multiplied by the ratio of relative importance (RI) to relative extent (RE) for each HVRA. This can be calculated for both eNVC and cNCV. The former includes the likelihood of fire occurring (BP) and is a true indicator of wildfire risk, the latter does not include the likelihood of fire occurring (BP=1) but assumes a fire to burn.
wNVC = ∑ (NVC) (RI/RE)
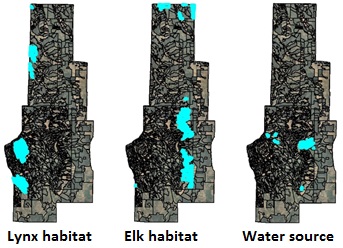
Response functions and relative importance for each HVRA in the Mt. Emily landscape.
|
FIL |
Lynx habitat |
Elk habitat |
Watershed |
|---|---|---|---|
|
1 |
10 | 20 | 0 |
|
2 |
0 | 10 | 0 |
|
3 |
-20 | 0 | -10 |
|
4 |
-40 | -20 | -30 |
| 5 | -80 | -40 | -50 |
| 6 | -100 | -60 | -80 |
| Relative Importance | 80 | 75 | 100 |
To determine the RI/RE ratio, you must find the RE of each of the three HVRAs.
In ArcMap, open the attributes table for the mt_emily_stands shapefile.
 , select all the stands within lynx habitat form following the figure below.
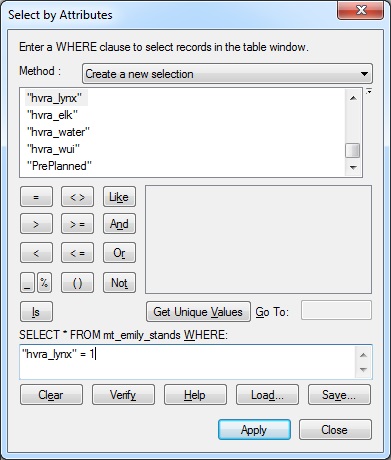
To determine the area within the HVRA, the Statistics... option in the attributes table will be used.
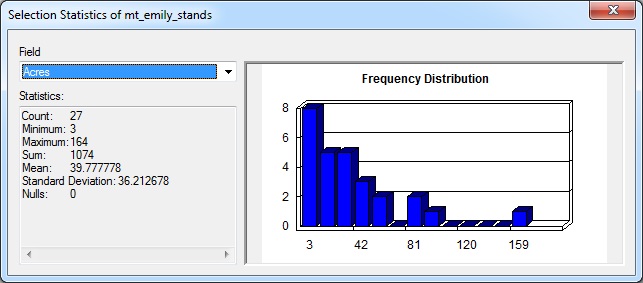
 clear the ArcMap selection.
|
HVRA |
Relative Importance |
Relative Extent |
RI/RE |
|---|---|---|---|
|
Lynx habitat |
80 | 1,074 | 0.074 |
|
Elk habitat |
75 | 1,272 | 0.059 |
|
Watershed |
100 | 259 | 0.386 |
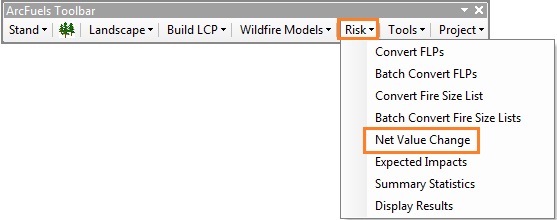
Click the Risk button on the ArcFuels10 toolbar, then select Net Value Change from the drop-down list.
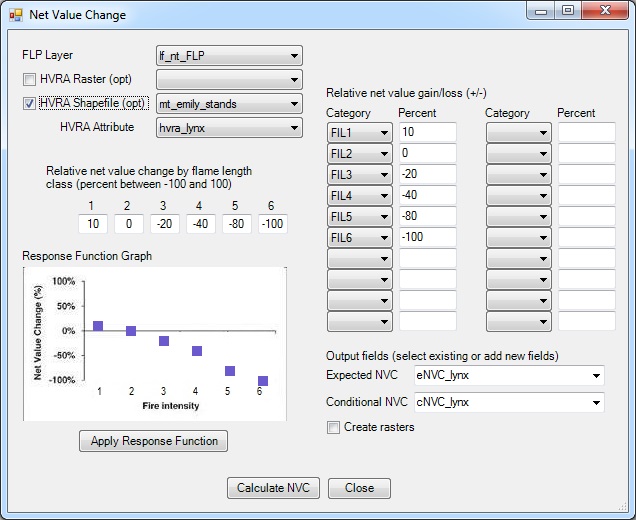
Fill out the Net Value Change form following the figure below.
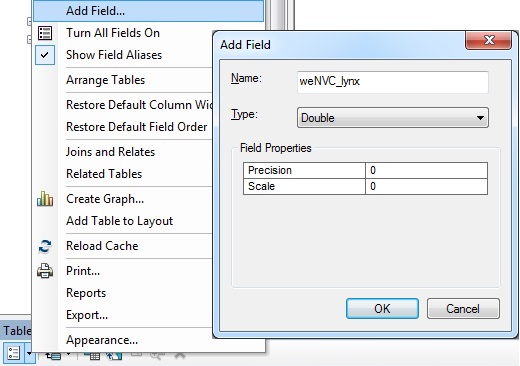
To calculate the weighted eNVC and weighted cNVC attribute fields will need to be added to the FLP point shapefile for each of the treatment alternatives
 button.

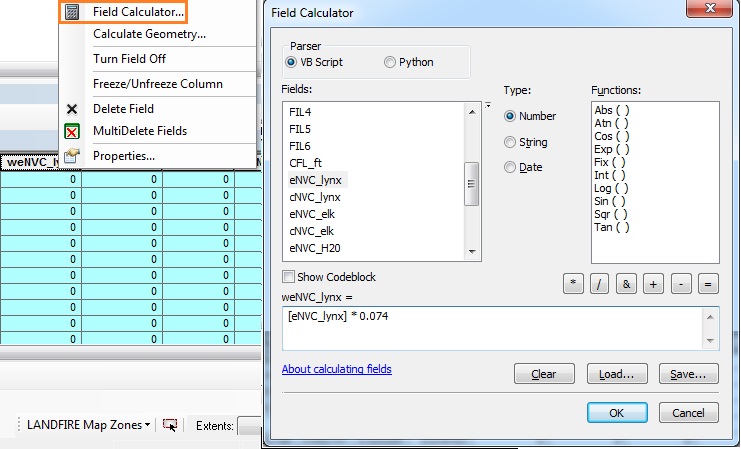
 button.
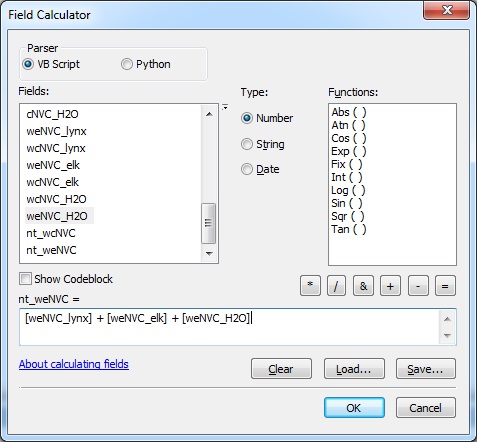
To determine the total weighted eNVC and cNVC for each treatment alternative, the Statistics... option in the attributes table will be used.
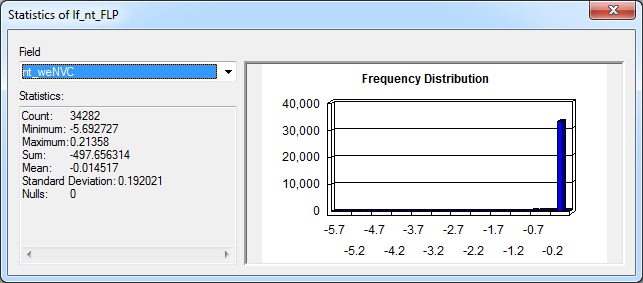
|
Treatment Alternative |
Weighted eNVC |
Weighted cNVC |
|---|---|---|
| No treatment | -497.656314 | -4163.683888 |
| Promotion of Resilience | -34.292114 | -1968.191819 |
| Hazard Reduction | -123.820276 | -1918.655585 |
Both treatments were more effective at reducing wildfire risk to the three HVRAs across the landscape. The treatment alternative for promotion of resilience was more effective at reducing the eNVC than the hazard reduction treatment alternative. This indicates that the placement of the treatments was more conducive to reducing the likelihood of fire interacting with the HVRAs. On the other hand, the hazard reduction treatment was more effective at reducing cNVC than the resilience alternative. This mean that if fire were to burn anywhere with equal likelihood the hazard reduction treatment is more effective. If conditional flame length and burn probability were summarized you would find that CFL is lower in the hazard alternative and BP is lower in the resilience alternative within the HVRA footprint.
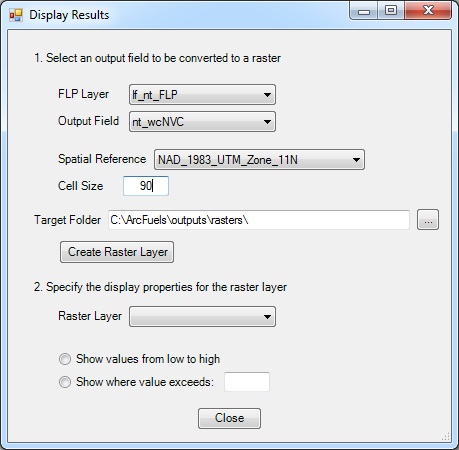
Finally, maps will be made for all three treatment alternatives for the weighted cNVC.
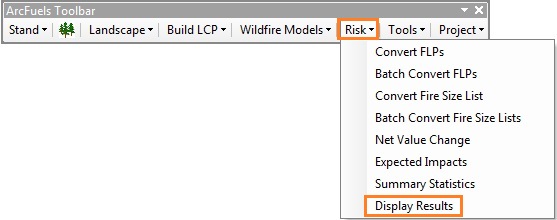
Click the Risk button on the ArcFuels10 toolbar, then select Display Results from the drop-down list.
Fill out the Display Results form following the figure below.
Return to ArcMap.
That concludes the Fuel Treatment Planning Scenario section of the online help. To learn more about setting up your data for use with ArcFuels go to Running ArcFuels10 with Your Data.