Classifying Fire Severity Based on simulated surface fuel combustion and heat transfer.
Fire severity classifications summarize and distill ecological impacts of fire on fuels, vegetation, wildlife, and soils in recently burned areas with the ultimate goal of predicting fire severity under similar fire conditions. The problem with most of these classifications, however, is that they are tailored to specific problems or needs and the data used to create them is usually distilled into classes of “low”, “moderate”, or “high” that are highly subjective and simplistic. New fire severity classifications must be made more objective and predictive, to ultimately be more useful to fire management and planning. To develop new fire severity classifications, research needs to relate the type of fire effects produced when diverse fuels burn with the physical properties of the fire (intensity, duration, temperature). This type of research is difficult to do in real time because hundreds or thousands of burns in different fuels and environmental conditions are needed to develop the understanding on which a meaningful classification can be made. Burning fuels with contemporary fire models can simulate combustion in many types of fuels quickly and safely, and it produces quantitative data to explore the fuels-moisture-fire relationship for each fuel bed to enhance predictability. Post-doctoral researcher Pamela Sikkink and research ecologist Robert Keane have developed a fire severity classification that uses simulated biomass consumption, fire residence time, fire intensities, and depth and temperatures of burns to classify the effects of fire on the biota. Their work summarizes the complex interactions of fire, fuels, and the biophysical environment into distinct severity classes that promotes a better understanding of how surface fuels and moisture affect burn severity.
The nine classes developed in this classification represent a range of physical effects of fire that will be useful to resource managers for planning and restoration activities. They are currently being used to develop fire-severity keys for a mapping system for real-time fire management (FIRESEV). They can also be used for making burn-severity estimates from prescribed fire plans or fuel reduction projects.
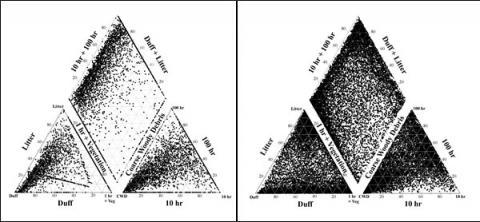
Figure 1 (top): Piper diagram showing proportion of each fuel component within individual fuel beds. (A) actual data set (n=4046); (B) synthetic data set (n=11528). Each dot on the piper diagram shows the makeup of one fuel bed; its position determined by percentage of each fuel type is found within the fuel bed. The lower left triangle consists of the smallest fuels; the lower right, the largest. Each corner of the small triangles = 100% of the respective fuel component. The 1-hr and 10-hr fine fuels are combined on the lower left triangle so that the percentage of vegetation biomass (herbs and shrubs) can be included with the small fuels. The placement of a fuel bed on the upper diamond depends on where the composition falls within each of the two lower triangles. If all fuel within the bed consists of only duff, the dot for the bed falls on the extreme left of the lower triangle and is projected to the upper portion of the diamond along with the proportion of litter. Scale = 0 to 100% along each edge of the lower triangles and along each edge of the upper diamond.
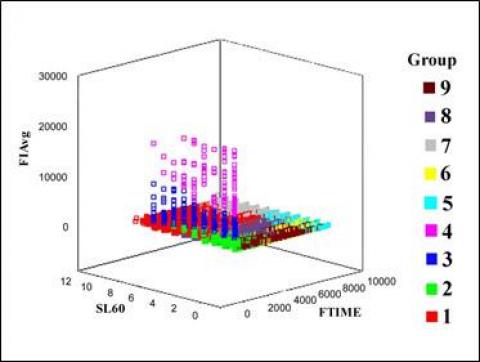
Figure 2 (bottom): Scatterplot of class distributions for the three variables explaining the most variation in the synthetic data set (FIAvg = Average fire intensity=46.9%; FTime= 27.6%; SL60=19.4%). Groups were created by agglomerative clustering. The most variation in fire intensity occurs within groups 2, 3, and 4. Plot shows results from simulation burning of all fuel beds in all moisture scenarios (n= 115,280).

